Query Studio / Report Studio
Report Example: Project Status List Report
|
This example walks you through creating a Project Status
report using Query Studio. It also gives you an example of how to use
conditional formatting to highlight specific data.
Note: The example
assumes you have access to Query Studio and that you have projects with
tasks of various different statuses.
Important:
You should use data from only one top-level folder in any given report.
Do not combine data from more than one grouping.
To create a Project Status report:
- In the Reports application,
on the tab toolbar, click Open Query Studio.
What Happens: Query Studio opens in a new window, with a blank
report in the right pane and a menu in the left pane.
Note: If the Presentation group is not visible, refresh the
Query Studio window.
- With Insert
Data selected (the default), open the Presentation
group and expand the Project Information
folder:
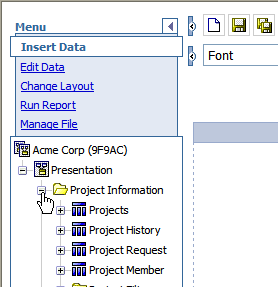
Note: All data used in this example will come from the Project
Information folder. If you use data from multiple folders in a report,
your results may be unpredictable.
- Expand the Projects
query subject and double-click the Project
Type query item.
Query subjects are indicated by the  icon and query items
are indicated with the
  icon. For more information about
the icons in the Presentation Data Model, see .
What Happens: A
Project Type column is added to your report.
Note: You can also drag and drop query items to a report (drag
and drop will not work in Firefox).
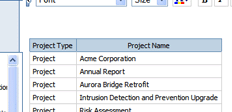
- Double-click the Project Name query item to add project
name to the report.
What Happens: A Project Name column is added to the report and
project type values duplicate if there are multiple projects of any one
project type.
- Select the Project
Type column and click the Group icon
 on the Query Studio toolbar
What Happens: Duplicate project types are removed from the report:

- Open the Tasks folder (within
the Project Information folder), expand the Tasks query subject, and double-click
the Task Status query item to add task status to the report.
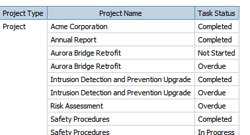
What Happens: Task status is added to the report and project
names are duplicated because there are multiple tasks in each project.
In addition, because you have not added tasks to the report, including
task status is not particularly useful.
- Select the Task Status
column and double-click Task Name to add the task name to the report.
What Happens: Task names are added to the left of the Task Status
column. Project Names are still duplicated based on the number of tasks
in each project.
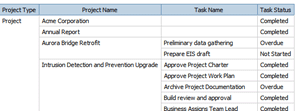
- Select Project Name and
click the Group icon to group by project name.
What Happens: Project name duplicates are removed from the report:
- Double-click Phase to add
project phase to your report.
What Happens: Project phase is added to the report after the
Task Status column, but project phase has no relationship to task status
so data results will be unpredictable.
- Select the Phase
column and click the Cut icon to cut the column.
- Select the Task
Name column and click the Paste icon to paste Phase
to the left of task name.
What Happens: Project phase is now inserted in the report immediately
after the Project Name column.
Because phase is an aspect of a project, this is a more logical place
to add the column and will give better results.
- Select the Task
Name column and then double-click Health
to add project health to the report between Phase
and Task Name.
- Double-click Planned Finish
(in the Task query subject) to add task planned finish to your report.
What Happens: Task planned finish is added after the Task Status
column.
- Click Task Status
to select the Task Status column.
You are going to add conditional formatting to the column, based on
data value.
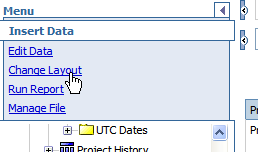
- In the Query Studio
menu, click Change Layout:
What Happens: The menu switches to the Change Layout menu:
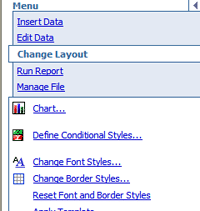
- Click Define
Conditional Styles.
The Define conditional styles window opens.
Note: If you do not have a report column selected, an error
message prompts you to select a column. Click Task Status.
- In the Define Conditional
Styles section, click Select values.

- Select Overdue
from the list of values and click OK.
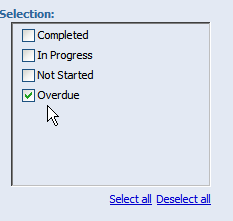
- Click the Edit icon
next to the Overdue selection:

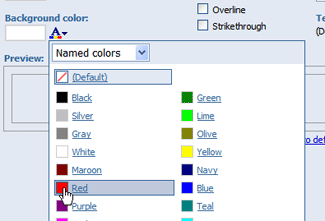
- Click Background
color and Red, then click
OK:
- Click OK
to close the Define conditional styles window.
What Happens: Any task status in the report is shown with a
red background:

Related Topics:


