 plot
data by using three axes.
plot
data by using three axes.
3-D Charts |
3-D charts are useful for creating charts with high visual content, such as graphics for use in presentations.
3-D column, bar, line, and area charts plot
data by using three axes.
3-D pie charts have a three-dimensional visual effect.
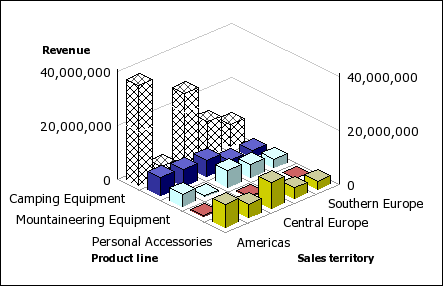
We recommend that you do not use 3-D charts where there is a need to show exact values, such as for control or monitoring purposes. The distortion in 3-D charts can make them difficult to read accurately.
This 3-D chart shows actual revenue for each product line in each territory. Note the skipping of the labels on the x and y axes.
Related Topics: