Aggregating Values in Crosstabs and Charts |
In crosstabs and charts, aggregated values are calculated using one of the following aggregate expressions:
You decide which aggregate expression is used by setting the aggregation mode.
Note: The Total function is valid for numeric fields. If used on non-numeric fields (Date fields for example) an error displays when you run the report.
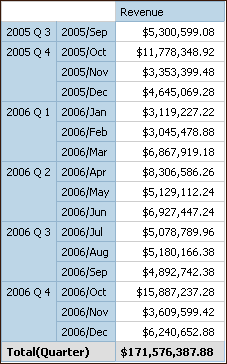
For example, in the following crosstab, if you specified Total as the summary, these aggregate expressions are produced for each aggregation mode:

In simple cases, the members and values visible in the report and the aggregate rules in the report are the same as those in the data source, and all of these expressions produce the same results.
For example, for the quarter and month values, if you are totaling the values for all months in all quarters, it makes no difference whether the visible values, the values in the cube, or month and quarter values are used. The result is the same.

Different results appear when you start filtering, changing aggregation types, or use set expressions or unions.
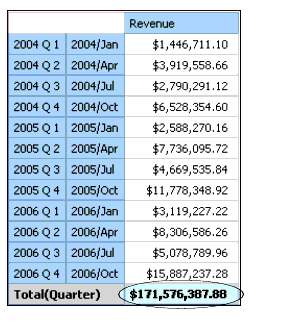
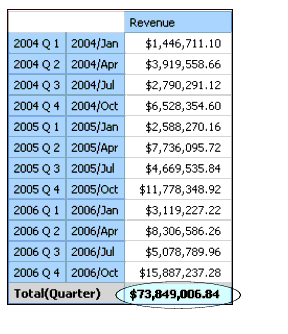
For example, if you replace month with an expression that returns only the first month in each quarter (January, April, July, and October), then the visible values you see in the crosstab are for only those months. If you then total the quarter values from the data source using the within set aggregation mode (total ([Revenue] within set [Quarter]), the result will include all months.

If you total the visible month values using the within detail aggregation mode (total [Revenue] within detail [Quarter]), then you are totaling the values from only the first month in each quarter. Consequently, you get different results.

In most cases, you should use the within detail aggregation mode because the results are easiest to understand, and they are the same as for footers in a grouped list report. In more complex cases, you may consider the within aggregate aggregation mode. The within set aggregation mode should be reserved for reports with a purely dimensional focus. For example, when there are no detail or summary filters defined in the report.
Related Topics: