Report Studio
You can create a report
which will show information based on the location of a particular data
point. This is useful for noting regional trends.
To Create a Map Report:
- .
By default an Introduction to the new PPM reporting capabilities displays.
Click Go to Reports to
close the introduction. A list of reports in the Public
Folder displays.
Note: You can disable the display of the introduction by selecting
Do not show this screen again.
- On the Tab Toolbar, click
Open Report Studio.
Note: The link is visible only if you are licensed as a Report Studio
Author.
- From the File
menu, click New.
- Click Map
and click OK.
- In the Choose
Map dialog box, in the Maps pane,
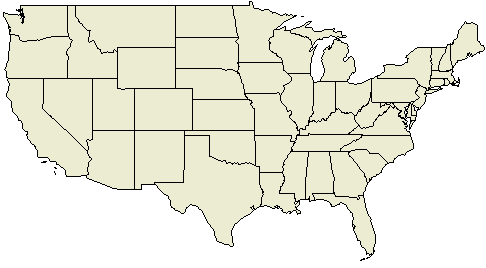
expand the folder Americas and click United States
(continental 48).
- In the Region
Layers box, click States.
- In the Point
Layers box, click None.
- In the Display
Layers box, click no option.
Note: You can select multiple display layers or deselect a display
layer by pressing Ctrl+right-click.
- Click OK.
Note: You can return to the Choose Map
dialog box at any time by double-clicking the map background.
- Click the run button on
the toolbar, and view the map.

Related Topics:

