About the Gantt Chart Canvas
|
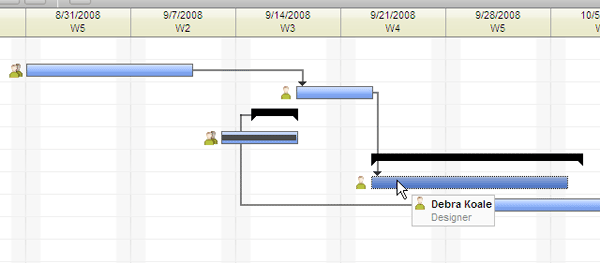
The Gantt chart canvas is the area of the Gantt chart that displays the schedule tasks in a graphical user interface. In PPM the canvas corresponds to what is commonly called a Gantt chart. The term "canvas" is used to differentiate it from the Task Grid and Sidebar areas of the Gantt chart.

In the canvas, you can:
- Add a task—Click and drag with your mouse in a row that does not contain an existing task to create a new task.

- Change an existing task—Click and drag the beginning of the end of a task bar to change the task duration.

- Move a task—Click on a task bar and drag it to move it to a new location in the same row.

Note: To change the task order in the list, move the task using the Task Grid. See About the Task Grid for more information.
- Create a dependency between tasks—Click on a task bar and drag to another task to create a dependency between the two tasks. For more information see Creating Task Dependencies.

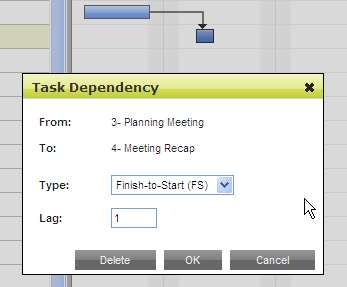
- Edit a dependency between tasks—Click on the link between two tasks to open the Task Dependency window.

- Assign resources to a task—Drag resources from the resource sidebar and drop them on a task to assign the resource. For more information, see Assigning Team Members to a Task in the Gantt Chart.

- View task details—Mouse over a task to see details about the task.

- View resource assignments and utilization—Mouse over the resources icon to see details about assignees. If a resource is listed with no percentage, 100% of their available time is allocated to the task.

Related
Topics:


