View Features of the Gantt Chart
|
The Gantt chart is designed to provide an easy-to-use visual interface project managers can use to view and manage their project schedules. A number of special features make the Gantt chart a unique application.
Note: Some of the
features of the Gantt chart are only accessible when you check the project task
schedule out. If you have not checked the
schedule out, you will not be able to add,
edit or delete tasks or view task details. Your ability to check a schedule out depends on your project role and permissions.
Features of the Gantt Chart:
Task Grid
The Grid includes details of tasks, including duration,
percent complete, start and finish dates, names of assigned resources,
and the numbers of any predecessor tasks. With the schedule checked out, you can edit these values within the Grid by clicking on a cell and typing.

The Task Grid is mostly hidden by the Gantt chart canvas by default.
To view it, double-click the vertical divider separating the Task List (on
the left of the window) from the Gantt Chart, or click and drag the divider. For more information about the Task Grid, see About the Gantt Chart Task Grid.
Gantt Chart Canvas
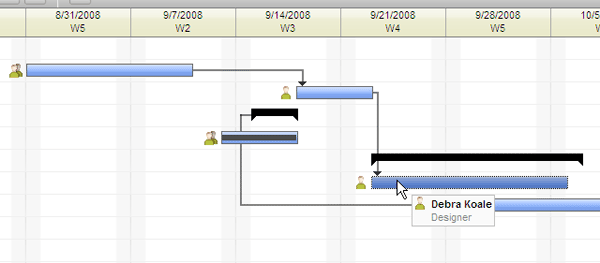
The Gantt chart canvas is the area of the Gantt chart in which the chart itself is displayed:

The Gantt chart canvas displays tasks, milestones, dependency links, resource icons (for tasks with assigned team members), critical path information and baseline comparisons. For more information about the Gantt chart canvas, see About the Gantt Chart Canvas.
Sidebar
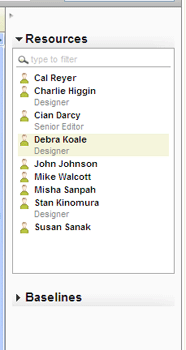
The Gantt chart Sidebar is a collapseable area that contains lists of available project team members and schedule baselines.

Use the Sidebar to add team members to tasks, and to create, select and remove baseline comparisons. For more information, see About the Gantt Chart Sidebar.
Related Topics:


