|
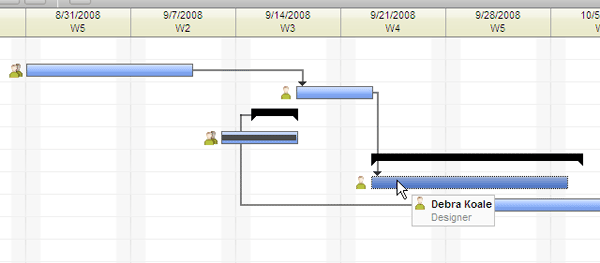
A Gantt chart provides a graphical overview of the tasks in your project schedule. The PPM Gantt chart is fully editable, allowing project managers to view, create and manage all project tasks in a simple, graphical format.

Drag-and-drop functionality makes it easy to set up tasks. Create milestone and summary tasks and drag between tasks to create dependencies. Copy existing tasks and paste them in another part of the schedule to duplicate or move tasks. Change task duration or start and end dates by dragging a task.
Task bars in the Gantt chart update automatically to show percentage of work complete, so you always know the project status.
Global nonworking time for the default workweek calendar displays in light red. These exceptions are created by a PPM administrator and affect users' net availability.
To assign team members to tasks, select resources by name, workgroup or skill, and drag them onto tasks in the Gantt chart. New allocation icons change automatically to show how much of a resource's time is assigned to project tasks, so team members never become over-allocated.
Note: You must check the task schedule out before you can make changes to it in the Gantt chart. (You can edit tasks from the List View and Outline View without checking the schedule out, but this is not recommended.) For more information, see Checking Out the Task Schedule for Editing.
Related Topics: