Crosstab Reports |
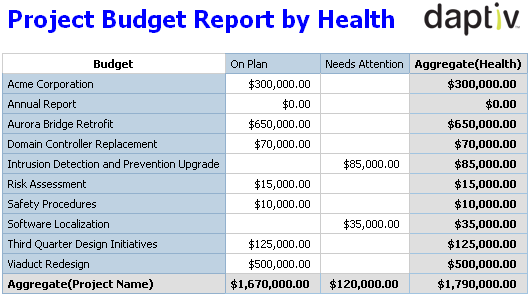
Use crosstab reports, also known as matrix reports, to show the relationships between three or more query items. Crosstab reports show data in rows and columns, with information summarized at the intersection points. For example, the crosstab report below shows budget by project by project health.
Like list reports, crosstab reports are reports that show data in rows and columns. However, the values at the intersection points of rows and columns show summarized information rather than detailed information.

For information about how to create a crosstab report, see Report Example: Resource Requirements Report.
Related Topics: