 integrate
multiple axes into a single radial figure. Data is plotted on each axis
and joined to adjacent axes by connecting lines.
integrate
multiple axes into a single radial figure. Data is plotted on each axis
and joined to adjacent axes by connecting lines.
Radar Charts |
Radar charts are useful as a comparative tool and for charts with few data series.
Radar charts integrate
multiple axes into a single radial figure. Data is plotted on each axis
and joined to adjacent axes by connecting lines.
This radar chart shows the revenue from multiple retailer types in multiple territories.
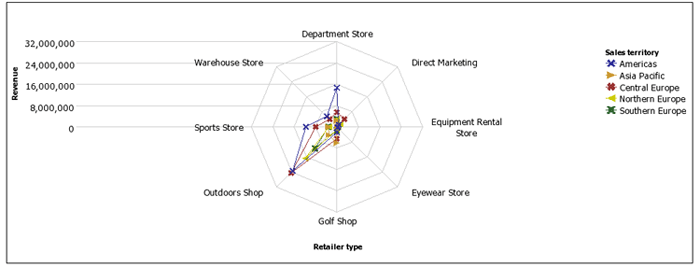
Radar charts can plot data using standard and stacked configurations.
Related Topics: