 use vertical data markers to
compare individual values.
Column Charts |
Column charts are useful to compare discrete data or to show trends over time.
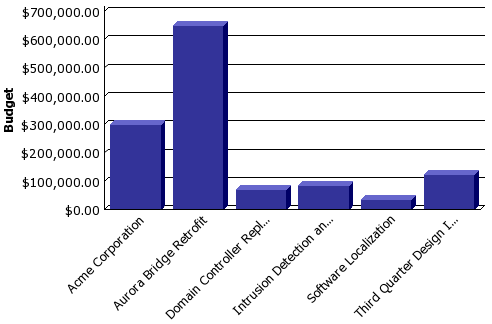
Column charts  use vertical data markers to
compare individual values.
This column chart shows the budget for each project:

Column charts can plot data using standard, stacked, 100% stacked, and 3-D configurations.
Related Topics: