The Report Studio Interface |
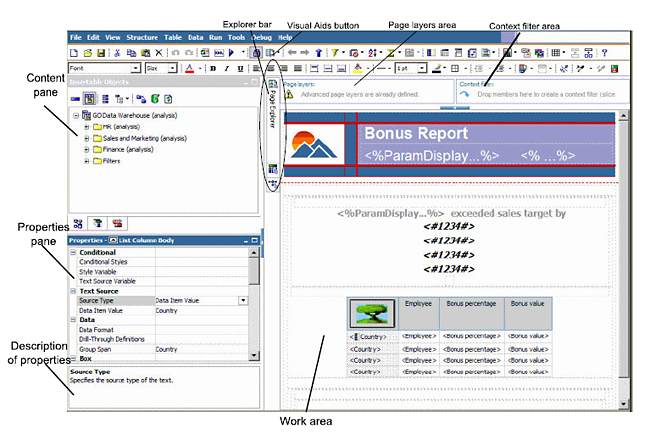
The Report Studio user interface has two panes, an explorer bar, and a work area to help you create reports.
Important: You should not use the Log Off option from the File menu. Clicking Log Off closes your connection to the reporting server. To reopen the connection, close the Report Studio window and reopen it from PPM Reports. The Log On option will not reopen your connection. Close the Report Studio window and reopen it to continue.
Note: For best results, use a screen resolution of at least 1024 by 768 pixels.
The content pane contains objects that you can add to a report. You add objects to a report by dragging them to the work area. The content pane contains these tabs:
 contains
items from the reporting data package selected for the report, such as data items and
calculations.
contains
items from the reporting data package selected for the report, such as data items and
calculations.  describes the queries created in the report.
  contains
a variety of objects that you can add to the report, such as text and
graphics.
contains
a variety of objects that you can add to the report, such as text and
graphics.  contains the results when you perform a search for members. You can insert the members found in a search directly into a report.
  shows the controls and active report variables inserted in a report and their relationships to one another. You can click a control in this tab to quickly locate the control in the report as well as set default values for variables.
 shows the active report variables defined in a report. Use this tab to create new variables and set default values.
The Properties pane lists the properties that you can set for an object in a report.
You can obtain additional information about a property by selecting it and clicking F1. For example, you can view the list of objects that uses each property.
When you specify a value for a property, press Enter, click another property, or save the report to ensure that the value is saved.
Note: View a description of the currently selected property at the bottom of the pane. From the View menu, click Property Descriptions.
Use the following buttons on the Explorer bar to work with different parts of a report:
The work area is where you design reports.
The visual aids button ![]() provides the following
options to help you when you are designing reports in the layout.
provides the following
options to help you when you are designing reports in the layout.
|
Option |
Description |
|
Show Boundary Lines |
Shows/hides all boundary lines around objects. |
|
Show Repeating |
Repeats objects when you insert them. For example, when you insert a data item in a crosstab, the data item appears in each row or in each column of the crosstab. |
|
Show Page Header & Footer |
Shows the page header and page footer. |
|
Show Drag & Drop Padding |
Shows drag-and-drop zone when the Padding property for an object is set to 0. If the Padding property is set to a value that is greater than the minimum padding that Report Studio uses to show drag-and-drop zones, only the minimum padding is shown. |
|
Show Hidden Objects |
Shows objects for which the Box Type property was set to None or for which the Visibility property was set to No. |
|
Show Sorting |
Shows the sorting icon for data items for which a sort order was specified. |
|
Show Grouping |
Shows the grouping icon for grouped data items . |
|
Show Source Type |
Shows the icon for the source type of objects, such as layout calculation. |
|
Show Data Item Type |
Shows the icon for the type of data item, such as query item, member or measure. |
|
Show Drill-Through Definitions |
Shows data items for which a drill-through definition was defined as hyperlinks. |
|
Show Table of Contents Entries |
Shows table of contents entries inserted in the report. |
|
Show Bookmarks |
Shows bookmarks inserted in the report. |
|
Show Master Detail Relationships |
Shows master detail relationships defined in the report. Note: Pausing the pointer over the master detail relationship icon shows the relationship. |
|
Show No Data Contents Tab Control |
Shows tabs if the data container's No Data Contents property is set to Yes.. |
|
Show Repeater and Singleton Containers |
Shows repeater and singleton containers inserted in the report. |
|
Show Interactive Object Controls |
Shows controls in the top right corner of active report application objects. For more information about active reports, see Active Reports. |
|
Show Container Selectors |
Shows Shows a small selector (three orange dots) in the top left corner of the following container objects and allows you to select all the objects within them: list, crosstab, repeater table, table of contents, table, and active report application objects. |
Related Topics: